Figure 2.

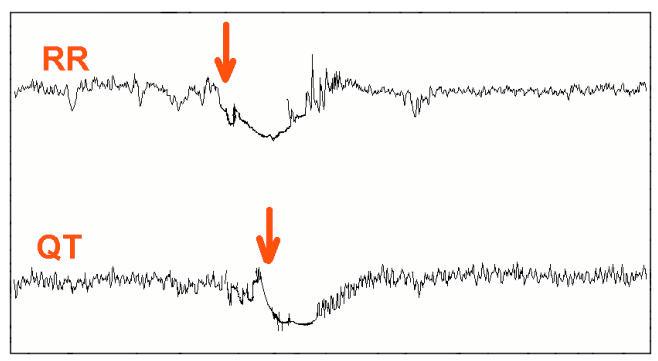
QT lag. Upper tracing: trend of RR intervals. Lower tracing: trend of QT intervals. The red arrows indicate the onset of change in heart rate and the delay in the corresponding change in QT interval.

QT lag. Upper tracing: trend of RR intervals. Lower tracing: trend of QT intervals. The red arrows indicate the onset of change in heart rate and the delay in the corresponding change in QT interval.