
Figure 5.
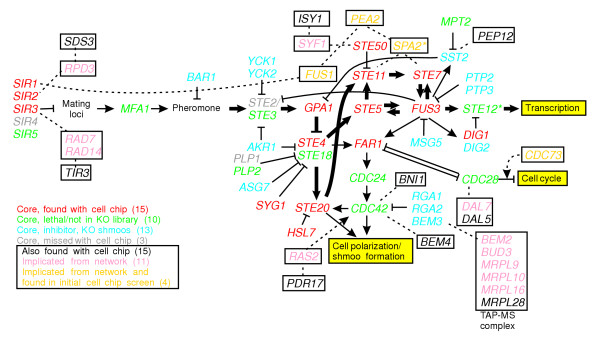
Comparison of results with the known response pathway. This comparison reveals that of the 18 known genes expected to be found in this screen, 15 were recovered (red labels); three core genes were missed (gray labels). Thirteen genes are pathway inhibitors (blue labels) whose corresponding deletion strains shmoo. Ten known pathway genes are absent from the deletion collection (green labels). Of the 15 putative additional genes found, nine (black labels, boxed) could be associated with the core pathway via protein interactions or mRNA coexpression with intermediates (pink labels, boxed). Four network-implicated intermediates (orange labels, boxed) were also found in the initial cell-chip screen, though not reconfirmed. Bold arrows mark the canonical signal transduction cascade leading to transcriptional changes. Thin black arrows indicate activation; barred lines indicate inhibition; dotted lines indicate functional genomics linkages [40]. Genes with asterisks are also implicated in filamentous growth [54].