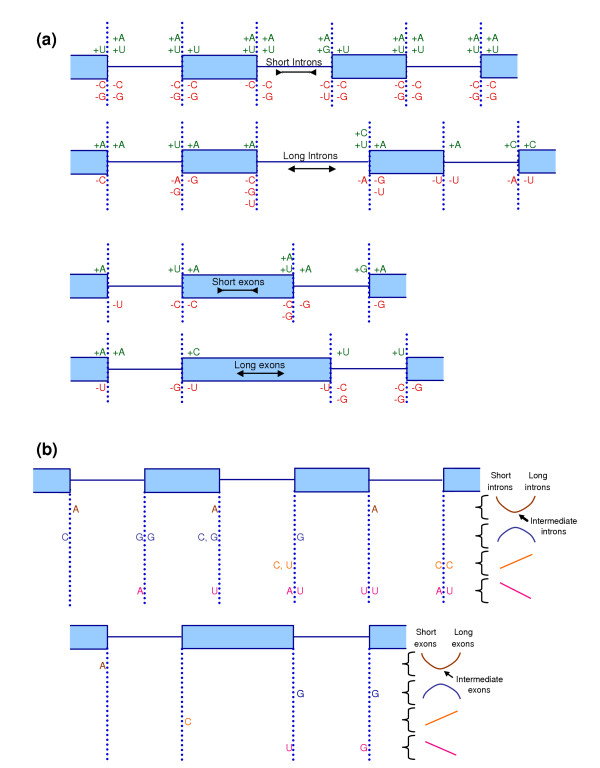
Figure 4.

Regional nucleotide content near splice sites. Differences in regional nucleotide content measured in 32 nucleotide regions adjacent to splice sites in the neighborhood of a varied intron or exon. Filled in rectangles denote exons; solid lines denote introns. (a) The comparisons made were: short introns (48 to 59 nucleotides (nt); n ≥ 3,417) with intermediate introns (64 to 1,023 nt; n ≥ 8953); long introns (2,048 to 16,383 nt; n ≥ 1,070) with intermediate introns; short exons (32 to 90 nt; n ≥ 1,515) with intermediate exons (128 to 511 nt; n ≥ 13,274); long exons (1,048 to 4,095 nt; n ≥ 1,364) with intermediate exons; where n denotes the sample size of each group. In each region, nucleotide contents were compared using a bootstrap alternative to the two-sample t test at the 1% significance level (see Materials and methods). Compared to intermediate introns or exons, short or long splice elements with significantly higher (or lower) nucleotide content are illustrated in green: +A, +C, +G, +U (or red: -A, -C, -G, -U). (b) The nucleotides pictured show significant changes in the indicated region for both short and long introns (or exons) when compared to intermediate length introns (or exons). In some cases, A is enriched, or C or G is depleted for both long and short splice elements. In other cases, A or U (and in one case G) is enriched for short and depleted for long splice elements. There are also cases where C (and in one case U) is depleted for short and enriched for long splice elements.
