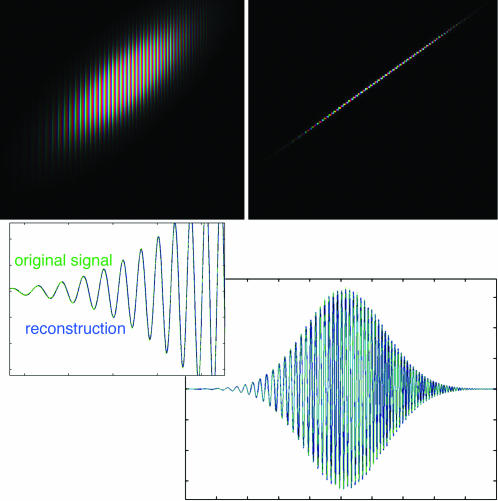
Fig. 5.
Reconstruction of a chirp from the complex reassigned STFT. (Upper Left) STFT of a chirp; intensity represents magnitude, and hue represents complex phase. The spacing between lines of equal phase narrows toward the upper right, corresponding to the linearly increasing frequency. (Upper Right) Complex reassigned STFT of the same signal. The width of this representation is one pixel; the oscillation follows the same pattern. (Lower) A vertical integral of the STFT (blue) reconstructs the original signal exactly; the vertical integral of the complex reassigned transform (green) agrees with the original signal almost exactly. (Note the integral must include the mirror-symmetric, complex conjugate negative frequencies to reconstruct real signals.) (Lower Right) Full range of the chirp. (Lower Left) A detail of the rising edge of the waveform, showing the green and blue curves superposing point by point.

