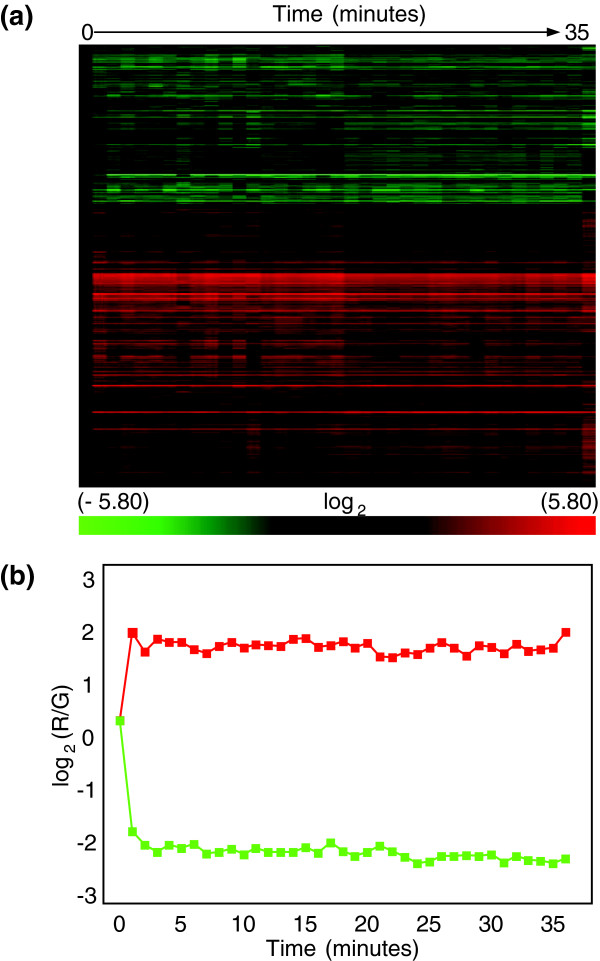
Figure 2.

Time course at 1 minute intervals in cells from stationary phase cultures exposed to 50 μM menadione. (a) Heat map of results from unsupervised hierarchical clustering (Pearson's centered, average-linkage) of approximately 2,000 transcripts from samples harvested at 1 minute intervals for 35 minutes with an additional sample taken at one hour. (b) Median values for the two major temporal patterns of changes in mRNA abundance plotted from the median values of mRNAs clustered in (a). RNA was isolated using the modified Gentra method described in Materials and methods.
