
Figure 3.
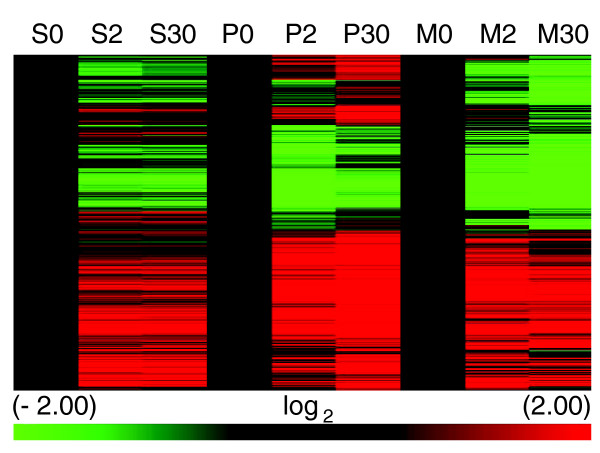
Time course of gene expression in wild type (S), parental (P), and rpb1-1 mutant (M) stationary phase cultures exposed to 50 μM menadione for 0, 2, and 30 minutes. Heat map of results from unsupervised hierarchical clustering (Pearson's centered, average-linkage). Approximately 1,000 transcripts were included in this analysis. Samples were taken at T0, T2, and T30 minutes after exposure to 50 μM menadione. The color scale at the bottom indicates the log2 values for changes in mRNA abundance.