
Figure 5.
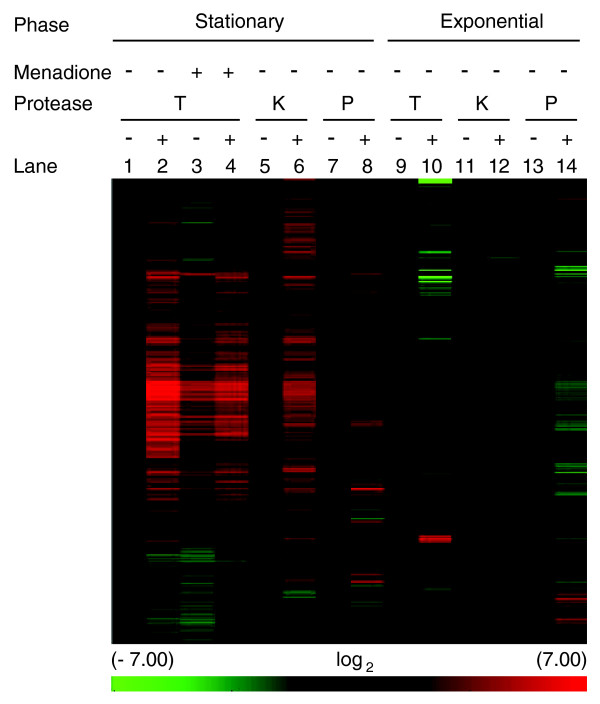
mRNA abundance in samples treated with or without protease. Unsupervised hierarchical clustering (Pearson's centered, average-linkage) of approximately 3,800 transcripts. Samples were incubated with buffer alone (-) or protease (+): trypsin (T), proteinase K (K), Qiagen protease (P). Results were normalized to untreated samples (lanes 1, 5, 7, 9, 11, or 13). Lanes 1 to 8: samples from stationary phase cultures. Lanes 3 and 4: stationary phase samples 2 minutes after treatment with menadione (+). Lanes 9 to 14: exponential samples treated with or without protease. The color scale at the bottom represents the log2 values for changes in mRNA abundance.