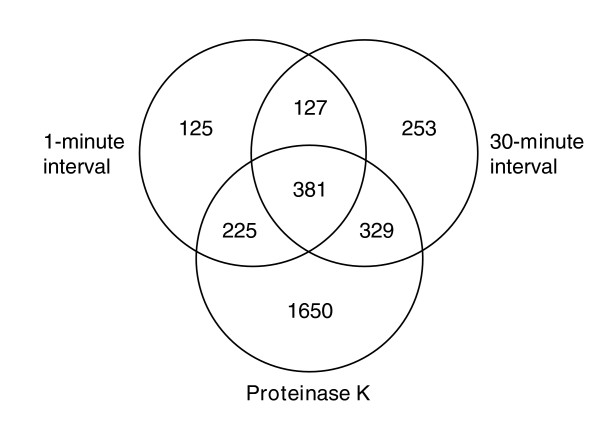
Figure 7.

Venn diagram of transcripts that increased after oxidative stress or proteinase K treatment of T0 cell lysates. Transcripts were evaluated that had a ≥2-fold increase in abundance by 1 and 30 minutes after oxidative stress or after proteinase K treatment. Transcripts were also required to have good spots in 80% of the time points.
