
Figure 8.
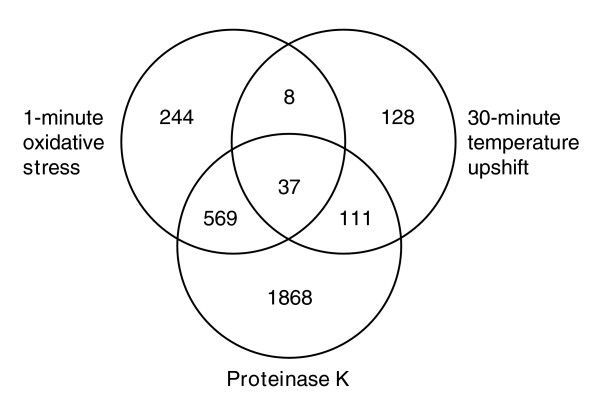
Venn diagram of transcripts that increased by 1 minute after oxidative stress, 30 minutes after temperature upshift, or after proteinase K treatment of T0 cell lysates. Transcripts used for this analysis were filtered as described in Figure 7.