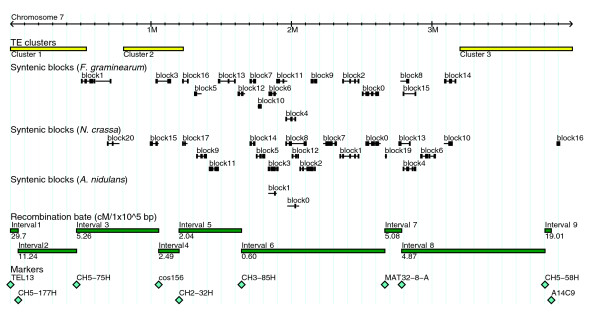
Figure 2.

Map of chromosome 7 showing relative locations of genetic markers and other features. Recombination rate between markers is expressed as centiMorgans per 100 kb. The locations of blocks of conserved synteny, recombination rate, TE clusters, and restriction fragment length polymorphism markers are shown.
