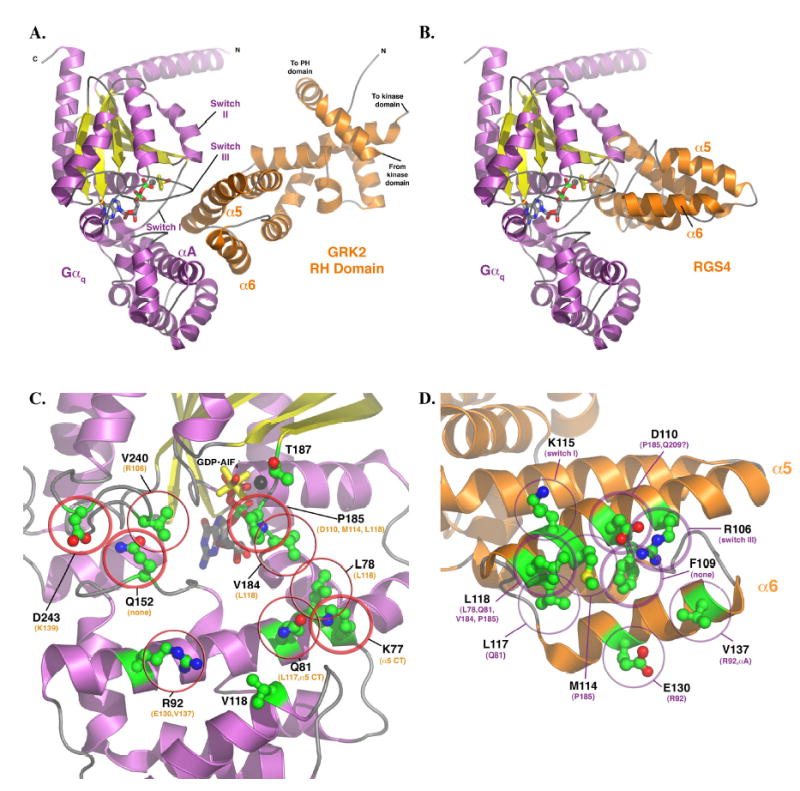
Figure 1.

(A) Model of the Gαq-GRK2 RH domain complex and their interacting surfaces. The model of Gαq was homology modeled based on the AlF4− bound structure of Gαi in complex with RGS4 (11) and then docked with the RH domain as described in Experimental Procedures. The switch regions and the αA helix of Gαq (purple and yellow) are labeled, as are the α5 and α6 helices of the GRK2 RH domain. These structural elements constitute the principal interaction surfaces of each protein. The proposed plane of the plasma membrane runs along the top of the complex, as shown in the figure. The switch regions of Gαq are delineated by V182 to Y192 (switch I), V204- T224 (switch II), and D236-R247 (switch III). (B) Model of Gαq in complex with RGS4, based on the atomic structure of Gαi-RGS4 (11). The RH domains of GRK2 and RGS4 both interact with the switch regions of the G protein, but the surface of the RH domain used in the contact is unique. In the RGS4 complex, the α5 helix faces out of the page, while in the Gαq-GRK2 complex it forms the principal contact surface. Panels (C) and (D) represent views of Gαq and GRK2, respectively, as if the complex shown in panel (A) were opened like a book. (C) The GRK2-interacting surface of Gαq. The residues shown as ball-and-stick models with green carbons are those mutated and analyzed in this study. Thick circles indicate residues that had a dramatic effect upon mutation (as per Table 1), thin circles indicate an “intermediate” effect, and no circles indicate no effect, at least upon GRK2 binding and inhibition of IP3 release. The residues listed in orange are those that each Gαq residue is predicted to contact. The black sphere represents Mg2+. (D) The Gαq-interacting surface of the GRK2 RH domain. The residues shown as balland- stick models with green carbons are those mutated and analyzed in this (L118 and E130) and our previous study (22). Thick circles indicate residues that had a dramatic effect upon mutation, thin circles indicate an “intermediate” effect, and no circles indicate no effect, at least upon Gαq binding. The residues listed in purple are those that each GRK2 residue is predicted to contact. All panels were created using PyMOL (38). The coordinates of the model of the Gαq-GRK2 RH domain complex are available in a pdb file as Supplementary Data.
