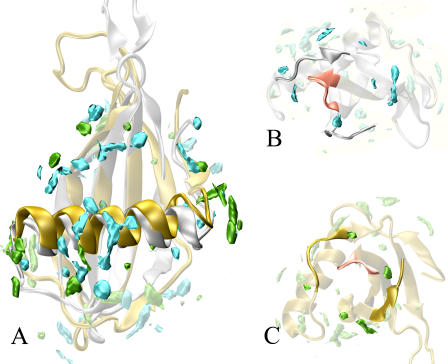
FIGURE 5.
Comparison of the water density maps of MNEI and G-16A mutant. The overall distribution of the MDHS is similar for the two proteins. The main differences occur in the helix region. Whereas MNEI shows a large concentration of MDHS in the middle region of the helix, the G-16A is more likely to be solvated in the endpoints of the helix. Conversely the L34 loop, a possible “sweet finger”, shows a comparable hydration profile. MD hydration sites are contoured at 2.5 times the bulk solvent value. The color code are cyan for wild-type MDHS, green for G-16A MDHS. The wild-type structure (PDB entry 1FA3) is represented by silver ribbons. G-16A structure (PDB entry 1M9G) is represented by golden ribbons. (A) General proteins hydration with the α-helix outlined. (B) Wild-type close-up view of L34 (pink). (C) G-16A close-up view of L34 (pink).

