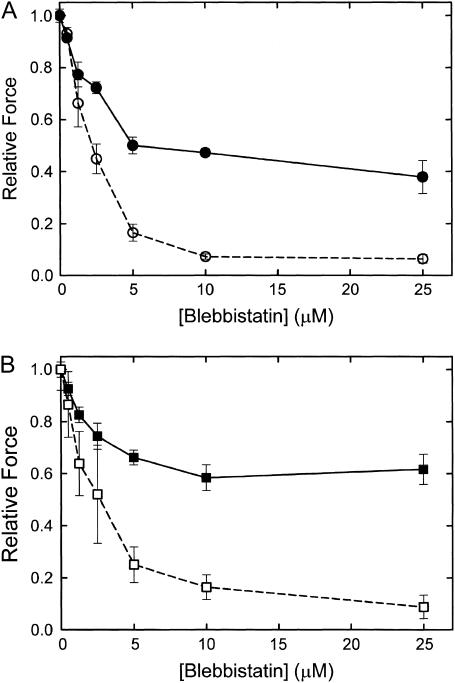
FIGURE 7.
Relationship between force and blebbistatin concentration in the presence and absence of twitchin phosphorylation. The experimental design was similar to that shown in Fig. 6. (A) pCa 5; (B) pCa 6. (Solid symbols, solid lines) −cAMP; (open symbols, dashed lines) +cAMP. Mean ± SE, N = 3–7.

