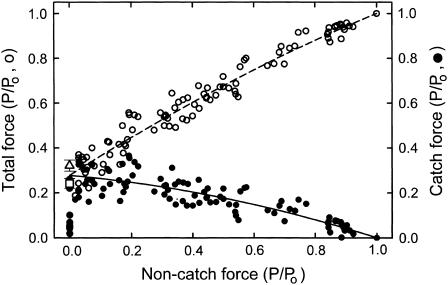
FIGURE 9.
Dependence of total force and catch force on noncatch force under various conditions. The data are derived from the same experiments shown in Fig. 8. Noncatch force is that remaining after addition of cAMP, whereas catch force (•, solid line) is the change in force resulting from addition of cAMP. Total force (○, dashed line) is the force before cAMP addition. Also shown are the mean ± SE for catch force remaining 10 min (▵) and 20 min (□) after switch from pCa 6 to pCa > 8. The lines are least-squares quadratic fits to the data.

