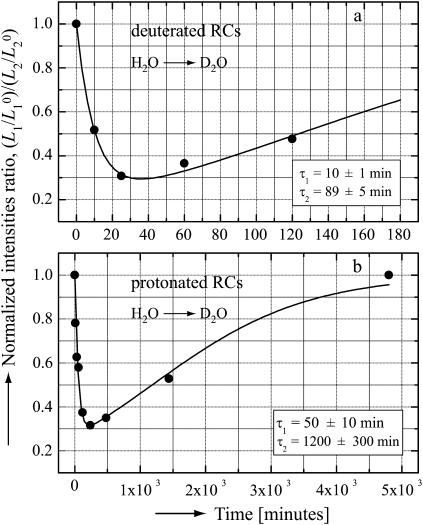
FIGURE 4.
The normalized intensities ratios ( ) for the low frequency 1H-ENDOR lines (see Fig. 3), as a function of the incubation time in D2O for deuterated RCs (a) and for protonated RCs (b). The 1H → 2H exchange times were obtained by fitting the experimental data (dots) with Eq. 3 (solid lines). The values of the exchange times τ1 and τ2 are shown in the inserts. Experimental conditions: Microwave frequency 35 GHz, T = 80 K, Bo at position corresponding to gy (see Fig. 2). Optical absorbance of sample
  (a) and 50 (b).

