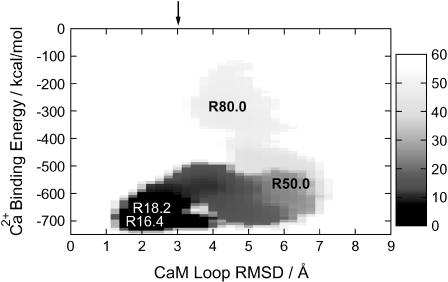
FIGURE 2.
Two-dimensional free-energy surface (potential of mean force) of Ca2+ binding to the CaM loop, where the x axis monitors the CaM loop deformation, whereas the y axis represents the strength of Ca2+ binding. More precisely, the x axis is the RMSD of heavy atoms in the side chain of CaM measured from the holo form, and the y axis is the direct interaction energy between Ca2+ and the CaM loop. The chart on the right side indicates mapping to the free-energy value (in kcal/mol). The arrow at the top indicates RMSD of the apo form. Characters on the map indicate corresponding values of the reaction coordinate R in the umbrella sampling simulations.

