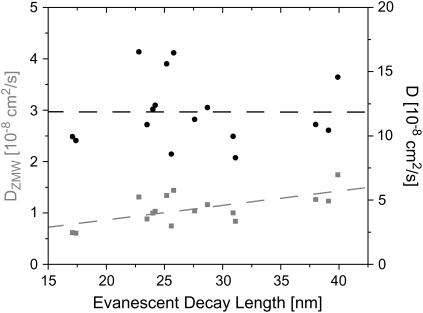
FIGURE 8.
A representative set of diffusion constants obtained by fitting FCS autocorrelation functions with the one-dimensional model (shaded squares). The estimate of the diffusion constant clearly depends on the evanescent decay length of the ZMW and hence on the size of the ZMW. The dashed line is a linear fit of the data. Past experiments, with fluorophores not confined to a membrane, have not displayed this dependence of D on L. When the conformation of the membrane in the ZMWs is accounted for, the correction of the estimated diffusion constant removes this dependence and produces a diffusion constant closer to accepted values. Solid circles represent the data corrected, assuming a membrane with a spherical cap of radius 50 nm at the bottom of the ZMWs.

