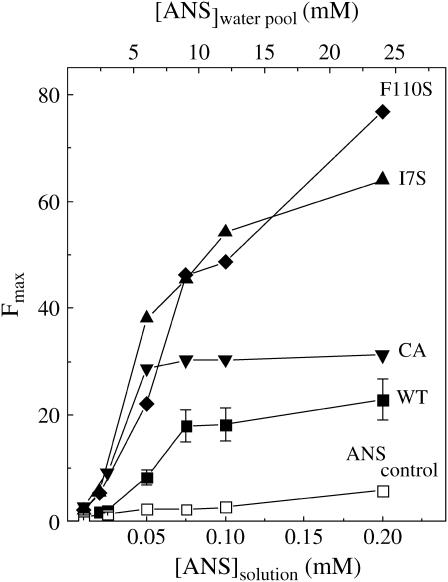
FIGURE 2.
ANS fluorescence intensity (Fmax) profiles of various azurin species (2.5 μM) in ice at −13°C as a function of the starting ANS concentration in solution: WT (▪), C3A/C26A (▾), I7S (▴), and F110S (♦). The control refers to a protein-free sample. Indicated on the top horizontal axis is the concentration of ANS in the water pools of ice, [ANS](water pool), estimated from a freeze concentration factor fc = 120 (12). Other conditions are as in Fig. 1.

