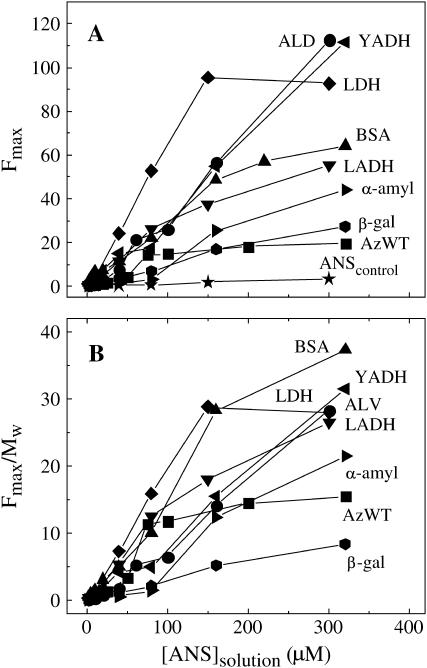
FIGURE 4.
(A) ANS fluorescence intensity (Fmax) profiles of various proteins (2.0 μM) in ice, at −13°C, as a function of the starting ANS concentration in solution: ALD (•), YADH (◂), LDH (♦), BSA (▴), LADH (▾), α-amylase (▸), β-gal ( ), and azurin WT (▪). Other conditions are as in Fig. 1. (B) The same ANS fluorescence profiles of Fig. 4 A normalized by the protein molecular weight (Table 2).

