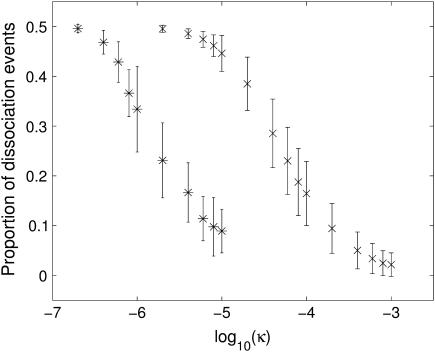
FIGURE 10.
Impact of the form factor κ on the speed of assembly. The figure shows the average proportion of dissociation events for 1stm (×) and 4sbv (*) calculated over 350 independent runs, with the standard deviation indicated by the error bars. As κ increases (making the association more likely), the proportion of dissociation events decays from 0.5 toward zero. Therefore, κ is directly related to the overall speed at which the assembly proceeds. If κ is small, the cascading process is not initiated and the assembly stalls. Clearly, detailed models for the calculation of the form factor κ would be of importance. Note the different κ-values at which both viruses would start to assemble, which is reminiscent of their proclivity to self-assembly in vitro.

