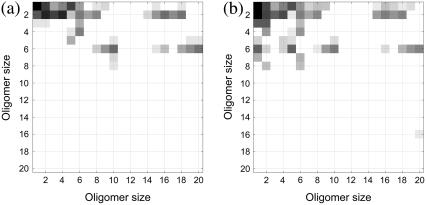
FIGURE 11.
Impact of the form factor κ on the pathways of assembly. Heat maps depicting the pattern of reactions for 1stm with (a) κ = 10−3 and (b) κ = 10−5. As compared to Fig. 7, note that the overall cascading pattern of reactions and pathways remains broadly unchanged. In panel a, larger κ means that there are fewer dissociation events, i.e., fewer dark squares below the diagonal (see Fig. 10). In panel b, smaller κ means more dissociation events, but the pattern of association for the larger oligomers is similar for all three 1stm heat maps.

