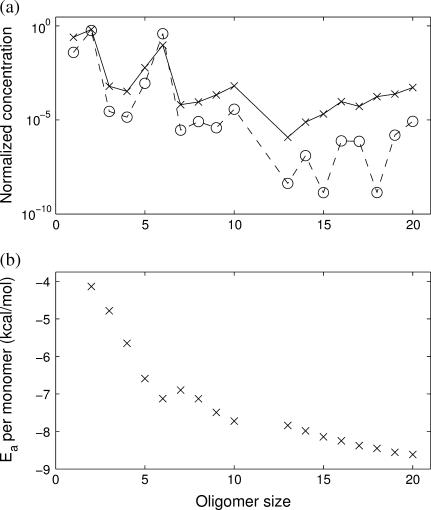
FIGURE 5.
Simulations of the quasi-stationary state of 1stm lumped by oligomer size. (a) Average time-weighted concentration of the different oligomer sizes obtained in the Gillespie simulation (crosses). The solid line is a guide to the eye. Note the high concentration of dimers and hexamers. The circles (and dashed line) show the prediction from the quasi-stationary Markov process (Eq. 3), which shows good agreement with the simulation. (b) Average time-weighted association energy per monomer of the different oligomer sizes. The error bars are hardly visible, indicating that all different conformations of a given size have almost identical association energies. Hexamers lie at a local minimum, a clear signal that they are stable oligomers, relatively more favorable than heptamers and octamers. Note the missing data points for size 11, as no 11-mers are observed in the simulations.

