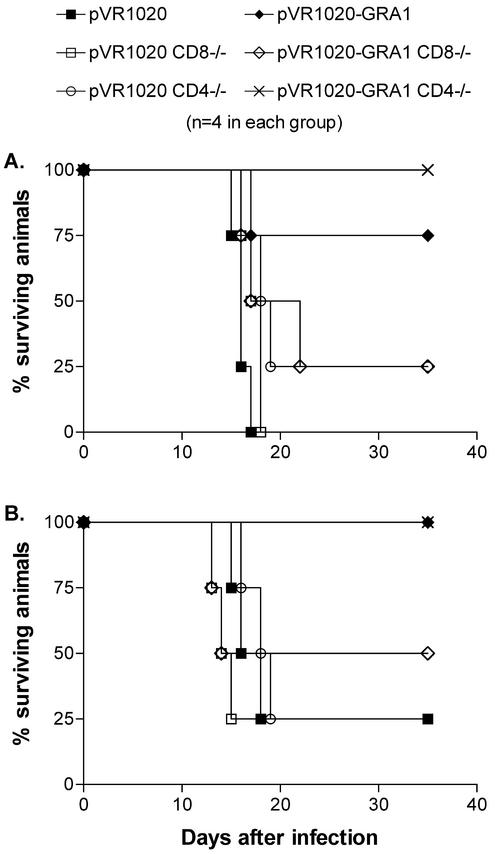
FIG. 5.
Survival curves for in vivo T-cell-depleted vaccinated C3H mice from two independent experiments (A and B). Mice were vaccinated with pVR1020 or pVR1020-GRA1 and challenged i.p. with 40 cysts of the T. gondii IPB-G strain (solid symbols). Mice that were subjected to CD8+ or CD4+ T-cell depletion (starting 1 day prior to challenge) are represented by open symbols. The depletion efficiency was monitored by cytofluorometric analysis of blood samples and was found to be 98 to 100%.

