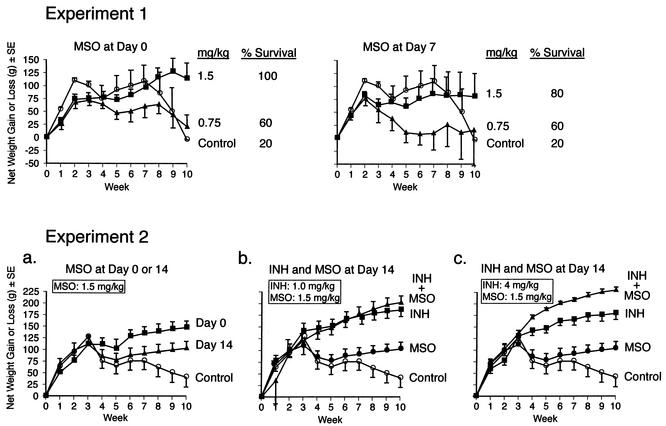
FIG. 2.
Weight loss and death after M. tuberculosis challenge. Animals in groups of five were infected with M. tuberculosis and treated with MSO and/or INH beginning 0, 7, or 14 days after challenge or not treated (control animals). All animals were weighed weekly for 10 weeks after challenge and monitored for survival. Weight data are the mean net weight gain or loss and standard error (SE) for each group of animals compared with their weights immediately before challenge. The survival data in experiment 1 are the percentages of animals surviving to the end of the 10-week observation period. In experiment 2, all animals survived to the end of the observation period.

