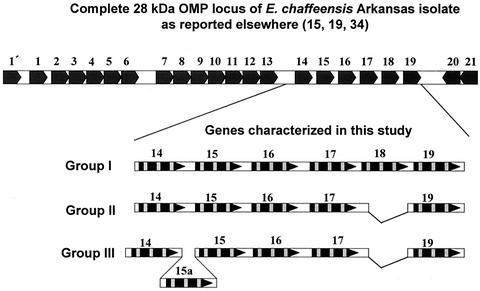
FIG. 3.
Comparison of nucleotide sequences of the 28-kDa gene amplicons of all three genetic group isolates. Sequences for genes 14 to 19 of the amplified 28-kDa OMP locus segments were generated by Sanger's manual dideoxy chain termination method with synthetic overlapping primers. The entire gene locus spanning all 22 genes present in the genome for the Arkansas isolate is presented at the top of the figure for comparison. Arrowheads indicate the orientation of the protein coding sequence. Protein coding sequences are identified with black boxes, and variable regions within the coding regions are highlighted by gray boxes.

