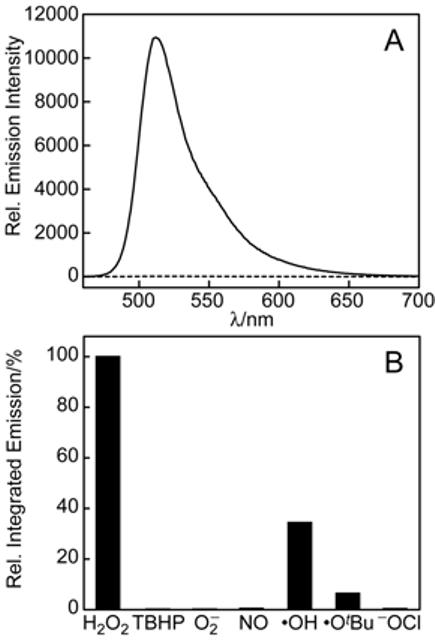
Figure 1.

(A) Fluorescence response of 5 μM PF1 to 100 μM H2O2. The dotted and solid line spectra were recorded before and after H2O2 addition, respectively. Spectra were acquired in 20 mM HEPES, pH 7 (λexc = 450 nm). (B) Fluorescence responses of 5 μM PF1 to various ROS (10 mM O2−, 100 μM for all other ROS). •OH and •OtBu were generated by reaction of Fe2+ with H2O2 or TBHP, respectively. NO was delivered using S-nitrosocysteine (SNOC). Spectra were acquired in 20 mM HEPES, pH 7, and all data were obtained after incubation with the appropriate ROS at 25 °C for 1 h. Collected emission was integrated between 460 and 700 nm (λexc = 450 nm).
