Figure 5.
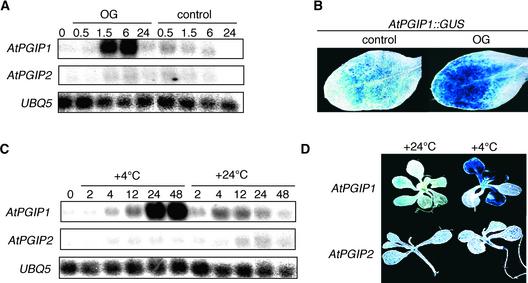
Induction of AtPGIP1 in Response to OGs and Low Temperature.
(A) RNA gel blot of seedlings incubated in the presence of 100 μg/mL OGs or in sterile medium (control) and harvested at the indicated times (in hours).
(B) AtPGIP1::GUS seedlings were treated as in (A) and stained for GUS activity after 6 h of treatment. The image shows the first leaf of a representative seedling treated with sterile medium (control) or OGs.
(C) RNA gel blot of Arabidopsis seedlings incubated at 4 or 24°C and harvested at the indicated times (in hours).
(D) AtPGIP1::GUS and AtPGIP2::GUS seedlings were incubated at 4 or 24°C for 48 h and stained for GUS activity. The image shows a representative seedling for each treatment.

