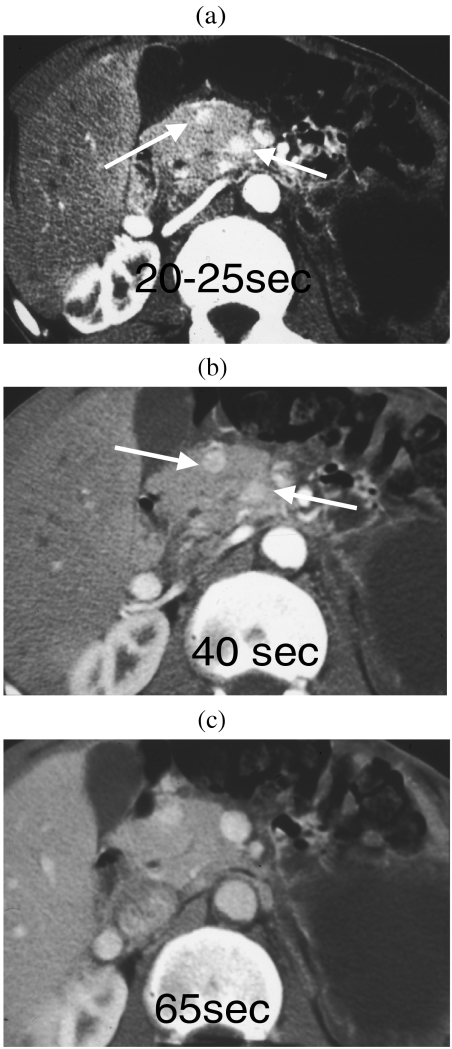
Figure 3.
The value of multiphase CT contrast-enhanced imaging in the detection of insulinomas. (a) Twenty-five seconds post contrast, two small hyperattenuating lesions are observed in the head of the pancreas (arrowed). (b) At 40 s there is optimal visualisation of both lesions. (c) At 65 s only one lesion is identified; the second has become isoattenuating.

