


Figure 2.
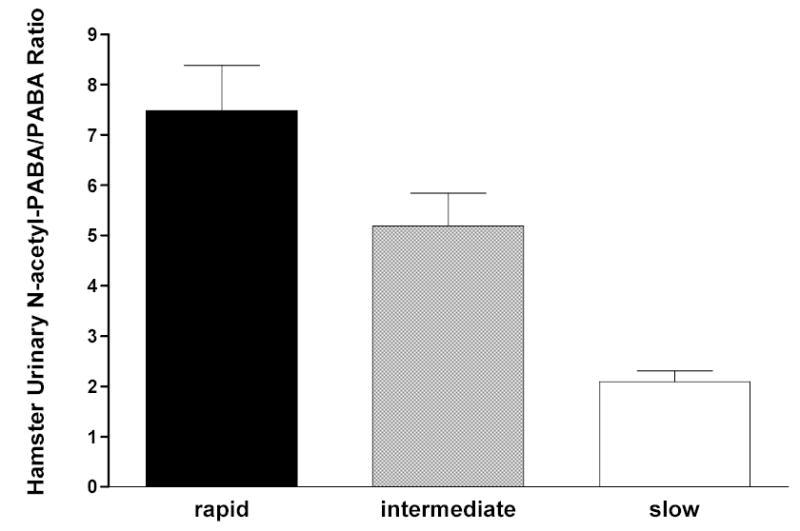
Each bar represents Mean ± SE for urinary excretion ratio of N-acetyl-p-aminobenzoic acid to p-aminobenzoic acid in Syrian hamsters with homozygous rapid acetylator genotype (black), heterozygous acetylator genotype (gray) or homozygous slow acetylator genotype (white). Differences among the genotypes were highly significant (p<0.0001) following one way analysis of variance. Adapted from Hein et al., 1994a.