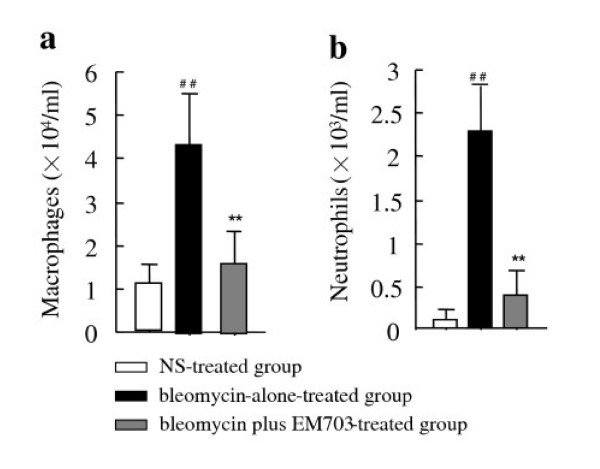
Figure 2.
The number of macrophages (a) and neutrophils (b) in BAL fluid on day 7 after bleomycin injection in ICR mice (n = 8). ##P < 0.01, significantly different from NS-treated group; **P < 0.01, significantly different from bleomycin-alone-treated group. The values are means, and the bars are SD.

