
Figure 2.
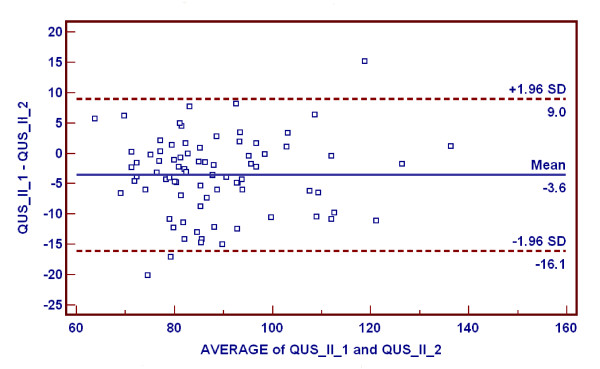
Bland-Altman plot used to examine minor systematic differences between the two QUS machines. Mean difference between the machines (QUS_II_1, QUS_II_2) was -3.56 ± 6.39 (standard deviation [SD]) dB/MHz.
Official websites use .gov
A
.gov website belongs to an official
government organization in the United States.
Secure .gov websites use HTTPS
A lock (
) or https:// means you've safely
connected to the .gov website. Share sensitive
information only on official, secure websites.
Bland-Altman plot used to examine minor systematic differences between the two QUS machines. Mean difference between the machines (QUS_II_1, QUS_II_2) was -3.56 ± 6.39 (standard deviation [SD]) dB/MHz.