
Figure 3.
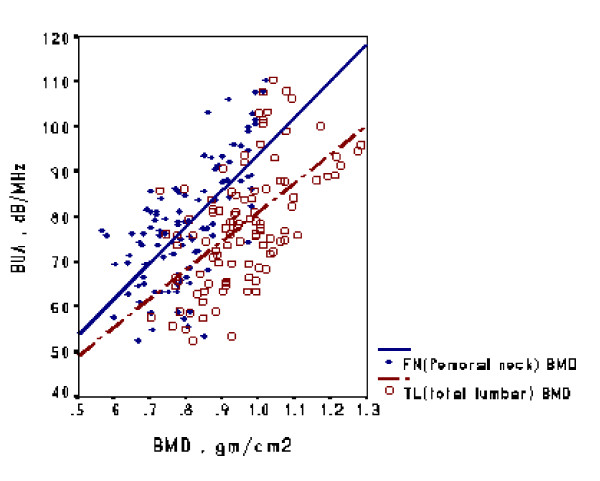
Correlation of QUS and DXA measurements. Mean (± standard deviation) BMD of the total lumbar (TL) region was higher than that of the femoral neck (FN) (0.96 ± 0.12 vs 0.80 ± 0.11; p < 0.001, paired t test).
Official websites use .gov
A
.gov website belongs to an official
government organization in the United States.
Secure .gov websites use HTTPS
A lock (
) or https:// means you've safely
connected to the .gov website. Share sensitive
information only on official, secure websites.
Correlation of QUS and DXA measurements. Mean (± standard deviation) BMD of the total lumbar (TL) region was higher than that of the femoral neck (FN) (0.96 ± 0.12 vs 0.80 ± 0.11; p < 0.001, paired t test).