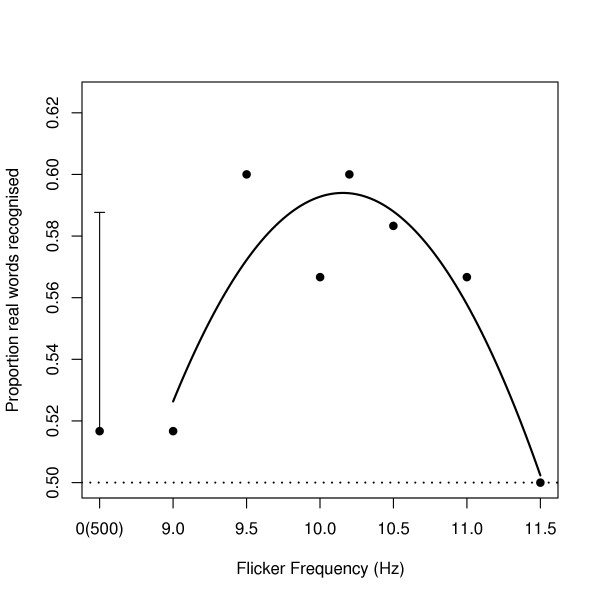
Figure 2.

shows the proportion of words that participants recognised in the test phase (ordinate) according to the frequency of flicker that preceded them in the learning phase (abscissa). The points are the mean proportions of raw data for flicker at 0–150 mcd and the curve is the fitted quadratic trend over visible flicker frequencies from the analysis (note that flicker was not visible in the 500 Hz condition, so its effective frequency was 0 Hz). The error bar represents the overall standard error of the mean.
