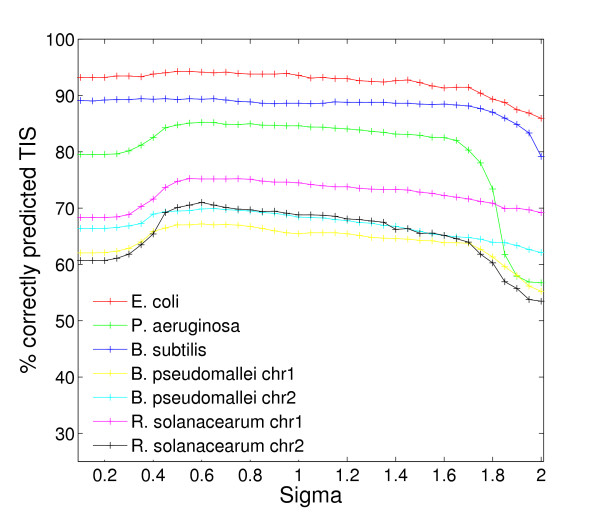
Figure 1.

Dependence on user-selected smoothing parameter. Performance of TICO on the genomes of E. coli, B. subtilis, P. aeruginosa, B. pseudomallei and R. solanacearum for a user-selected smoothing parameter varying according to σ = {0.1, 0.15, ..., 2.0}. Performance is measured in percentage of correctly predicted TIS as compared with the respective reference dataset (see section »Datasets« for details).
