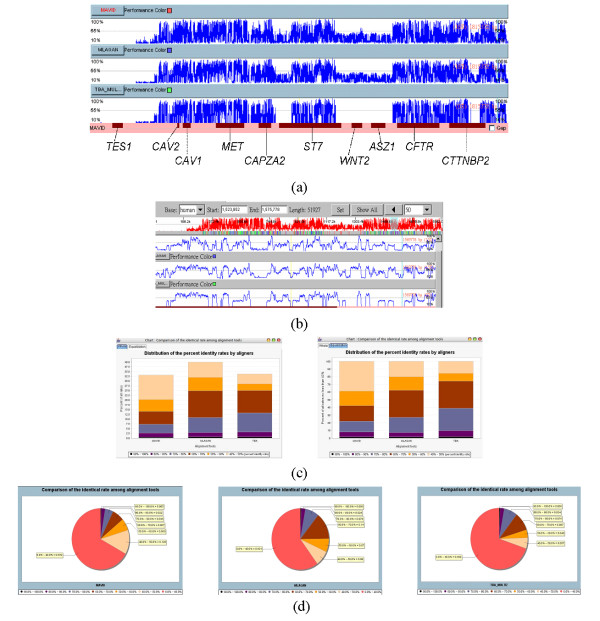
Figure 5.

The comparison of different alignment results of great CFTR gene regions. The cross comparison of three alignment results by SinicView. (a) The whole scale PIP curves using the human one as reference. (b) The detailed view of (a). (c) Comparison of the results in the whole and equalization stacked-bar charts. (d) Comparison of the results in the pie charts.
