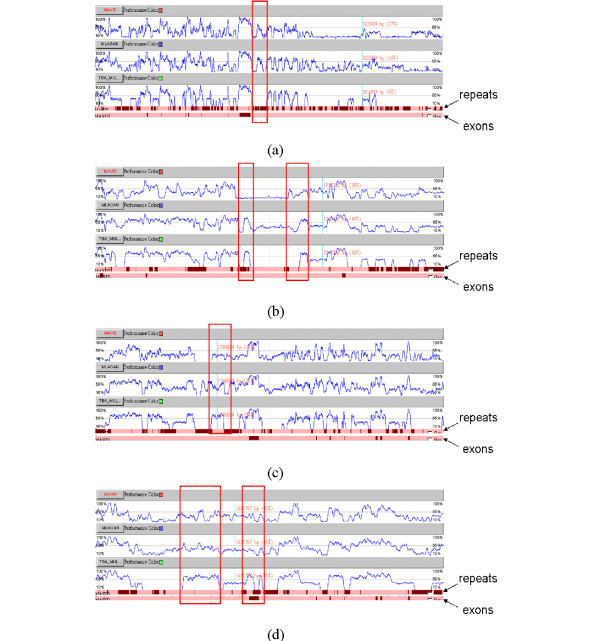
Figure 6.

The detailed comparison of Example 2. The detailed comparison of different alignment results of great CFTR gene regions at different intervals. (a) From 786,112 bp to 836,774 bp. (b) From 1,500,792 bp to 1,523,689 bp. (c) From 1,583,342 bp to 1,621,404 bp. (d) From 1,623,603 bp to 1,644,063 bp.
