
Figure 3.
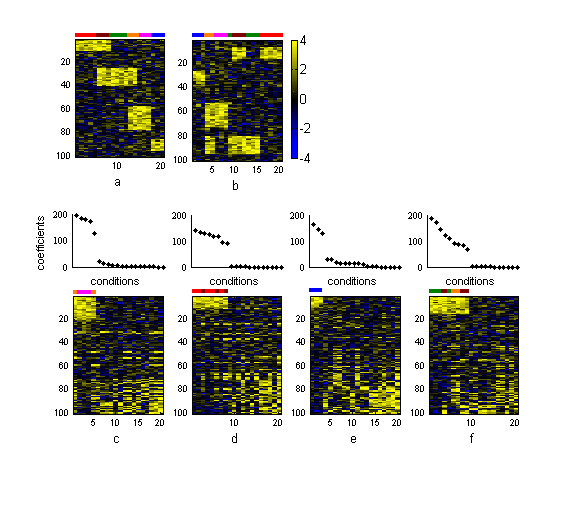
Results from synthetic dataset B (a) Original dataset with the three embedded patterns and (b) the same dataset sorted by two-way hierarchical clustering. Heatmaps of the original dataset sorted by the (c) first, (d) second, (e) third and (f) fourth basis genes and basis experiments yielded by nsNMF at k = 4 are shown in the bottom part of the figure. Non-overlapping conditions of Plb are marked in red, non-overlapping conditions of P2b are marked in green and non-overlapping conditions of P3b are marked in magenta. The overlapped area between Plb and P2b is marked in brown while the overlapped columns between P2b and P3b are marked in orange. Columns of P4b are marked in blue. Plots over the heatmaps represent coefficients of conditions in each sorted basis gene. The sorted basis genes present gaps indicating the set of conditions belonging to each pattern.