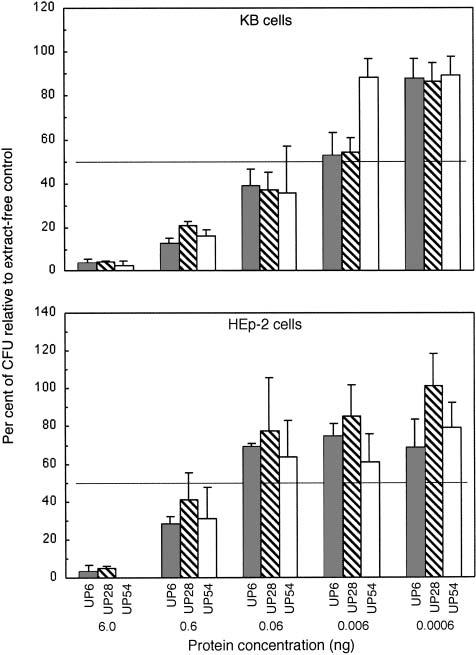
Fig. 4.

Determination of TD50 concentrations of CDT-containing extracts from A. actinomycetemcomitans. Cells were exposed to 0.0006–6.0 ng of total protein from strains UP6, UP28 and UP54 for 6 days. Upper panel, 1000 KB cells/well; lower panel, 1000 HEp-2 cells/well. Experiments were performed in six-well plates. Stained colonies were counted and data were plotted as described in the legend to Fig. 2.
