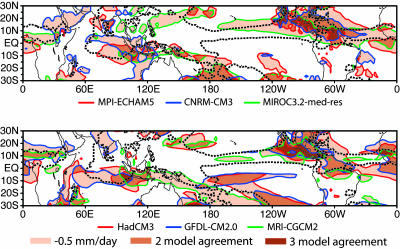
Fig. 1.
Examples of dry region precipitation change in the JJA season for 2070–2099 relative to 1901–1960 (mm day−1) from six of the ocean–atmosphere climate models, for the Special Report on Emissions Scenarios A2 global warming scenario. Contour line colors correspond to different models. Model acronyms are given in Methods. Shading denotes precipitation decreases exceeding 0.5 mm day−1, with darker shading where these regions overlap for more than one of the three models shown on each panel. The dashed black contour gives the observed climatological 4 mm day−1 contour, which typifies the shape of the mean convection zones.

