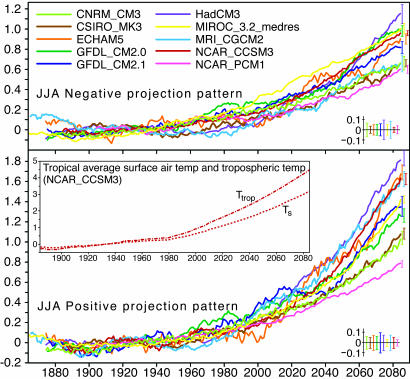
Fig. 2.
Amplitude of dry and wet precipitation changes (30-year running mean, relative to 1901–1960) for JJA from 10 ocean–atmosphere climate models for the Special Report on Emissions Scenarios A2 global warming scenario. The anomaly at each year is projected onto the normalized spatial pattern of late-21st-century (2070–2099 average) negative and positive precipitation change, respectively. Units are mm day−1. The error bars on the model lines, repeated at bottom right, are ±1 standard deviation values of the same projection quantity evaluated for internal variability in the control runs for each model. Inset shows the increase of tropical average surface air temperature, ΔTs, and vertical average tropospheric temperature (275–900 hPa), ΔTtrop, for a single model that has late-21st-century warming close to the multimodel ensemble mean.

