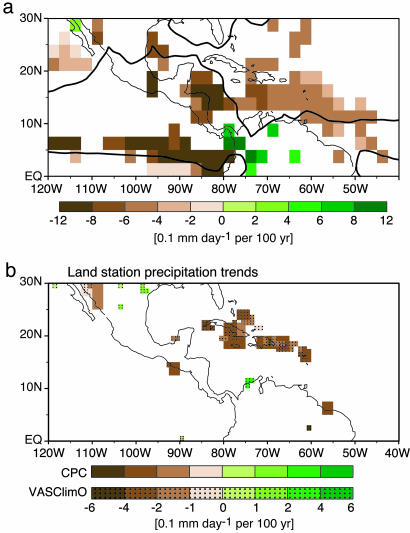
Fig. 6.
Precipitation trend from observed estimates for JJA. (a) Climate Prediction Center Merged Analysis of Precipitation satellite-only product for 1979–2003. The 4 mm day−1 contour from the climatological average over this period is shown in black for reference. (b) Gridded station data (partial land and island coverage only) from two data sets: Climate Prediction Center (34) (CPC; 2.5° resolution, 1950–2002) and Variability Analyses of Surface Climate Observations (33) (VASClimO; overlaid at 1° resolution, 1951–2000). Shading indicates regions exceeding the 95% significance level by the Spearman-rho rank-based test. Note that the color bar in a is at double the interval of that in b.

