
Fig. A1.
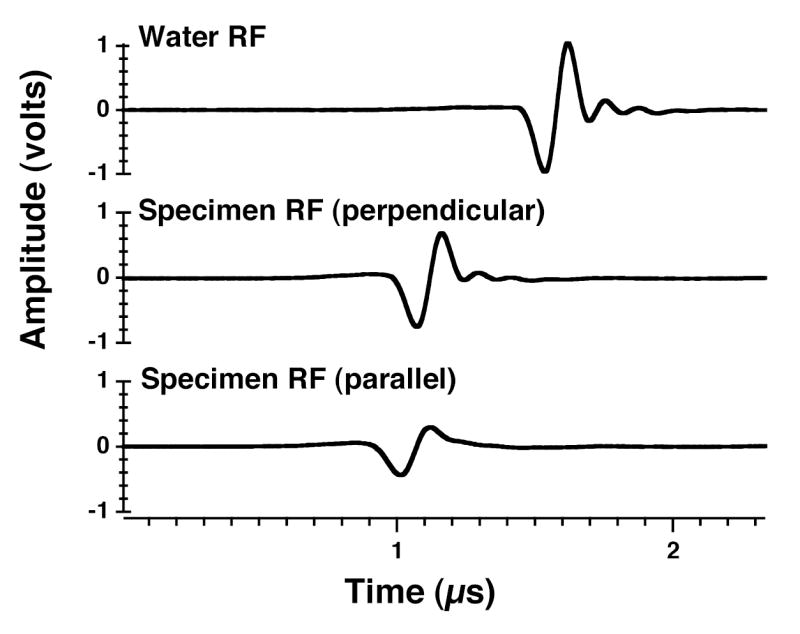
Radiofrequency traces for water reference (top panel) and a representative myocardial specimen at perpendicular insonification (minimum attenuation) (middle panel) and at parallel insonification (maximum attenuation) (bottom panel).
Official websites use .gov
A
.gov website belongs to an official
government organization in the United States.
Secure .gov websites use HTTPS
A lock (
) or https:// means you've safely
connected to the .gov website. Share sensitive
information only on official, secure websites.
Radiofrequency traces for water reference (top panel) and a representative myocardial specimen at perpendicular insonification (minimum attenuation) (middle panel) and at parallel insonification (maximum attenuation) (bottom panel).