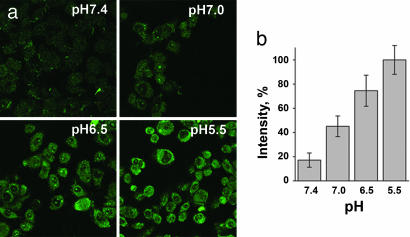
Fig. 2.
pHLIP transport of dansyl into cells. (a) Fluorescence images of HeLa cells incubated (for 15 min) with cleavable pHLIP–S–S–dansyl construct (7 μM) at pH 5.5, 6.5, 7.0, and 7.4 and washed with PBS buffer at pH 7.4 are shown. (b) Quantification of fluorescence images. The fluorescence signal of cells at pH 5.5 was taken as 100%. The uptake of dansyl strongly decreases with an increase of extracellular incubation pH.

