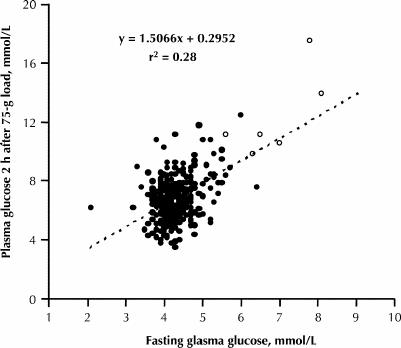
Fig. 2: Simple correlation between fasting plasma glucose level (X axis) and plasma glucose level 2 hours after a 75-g oral glucose tolerance test (OGTT) (Y axis) in 300 pregnant women who had abnormal results on initial screening with a 50-g oral glucose load. The 6 open symbols represent the women who were put on insulin after the OGTT. When the 2 women with fasting plasma glucose concentrations around 8 mmol/L were excluded, the r2 coefficient was reduced to 0.17.
