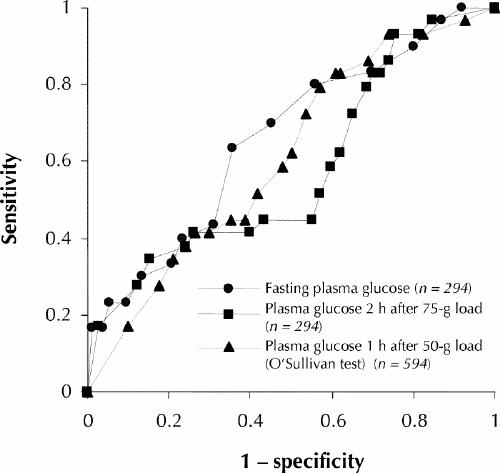
Fig. 4: Receiver operating characteristic (ROC) curves for large-for-gestational-age neonates (90th percentile or larger) against 3 plasma glucose variables: fasting plasma glucose, plasma glucose 2 hours after a 75-g glucose load and plasma glucose 1 hour after a 50-g glucose load (the O'Sullivan screening test). The areas under the ROC curves were 0.67, 0.61 and 0.52 respectively, which indicates the relatively poor diagnostic performance of these tests, and there were no statistically significant differences among them (p > 0.05). The dotted diagonal line illustrates a theoretical test in which there would be no diagnostic discrimination.
