
Figure 10.
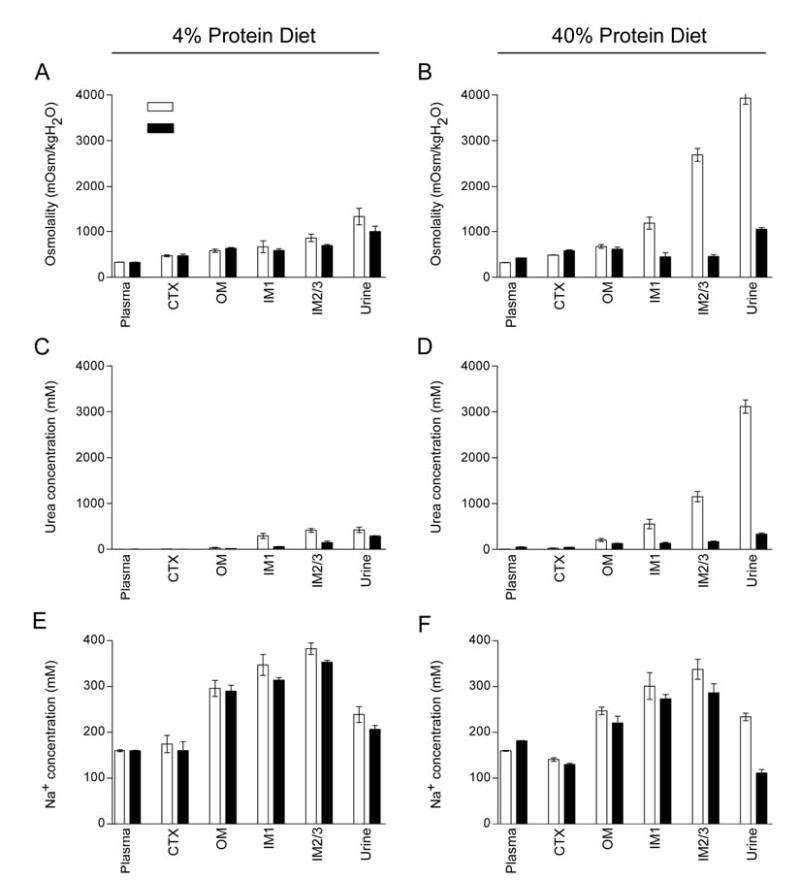
Comparison of kidney solute composition of wild-type and UT-A1/3−/− mice. For all graphs, values are mean ± SE and a significant difference (ANOVA) between wild-type mice (clear bars) and UT-A1/3−/− mice (solid bars) is indicated. Mice received either a 4% or 40% protein intake for 7 days before and throughout the duration of the study. The sections of tissue analyzed for determining values are shown in Figure 7. Graphs show; Osmolality on either a 4% protein intake (A) or 40% protein intake (B); Urea concentration on either a 4% protein intake (C) or 40% protein intake (D); Na concentration on either a 4% protein intake (E) or 40% protein intake (F).