
Figure 2.
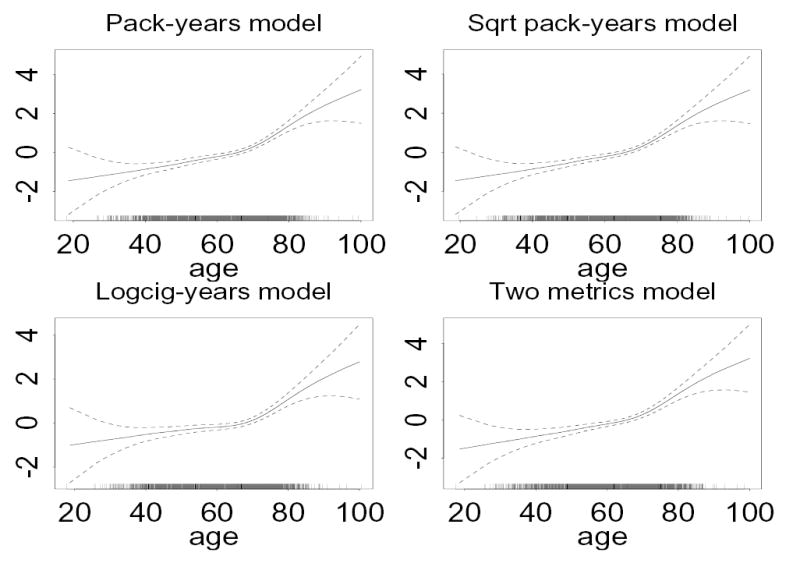
The contribution of age (x-axis) to the logit probability of lung cancer (y-axis) among all individuals, from generalized additive models adjusting for the metric indicated in the heading (as a smooth function), gender, smoking status (as two indicator variables), and years since smoking cessation (as a smooth function). Each plot is fit from a separate model. Dashed lines give pointwise approximate 95% confidence intervals for the fitted curve.