
Figure 3.
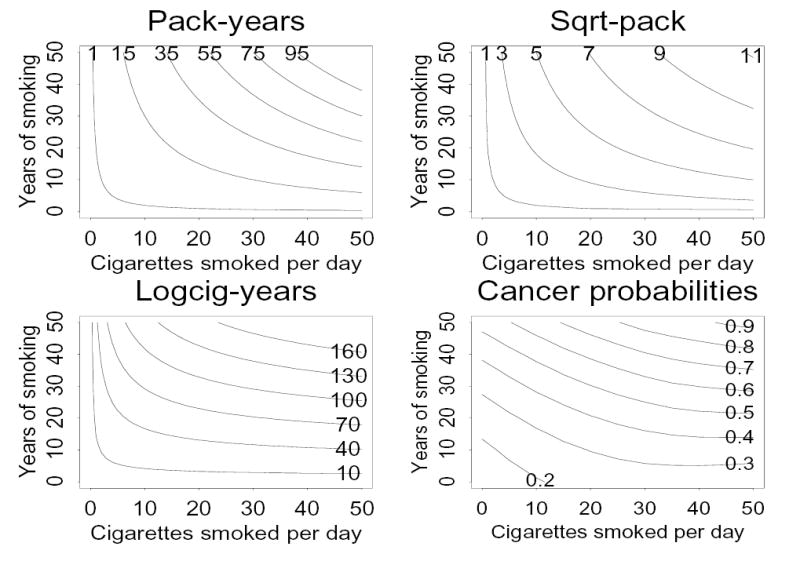
Lines of constant values of pack-years (upper left), square-root pack-years (upper right), and logcig-years (lower left), and from a two-dimensional smooth of cancer risk estimated from the lung cancer data (lower right), as a function of cigarettes smoked per day and years of smoking.