
FIG. 11.
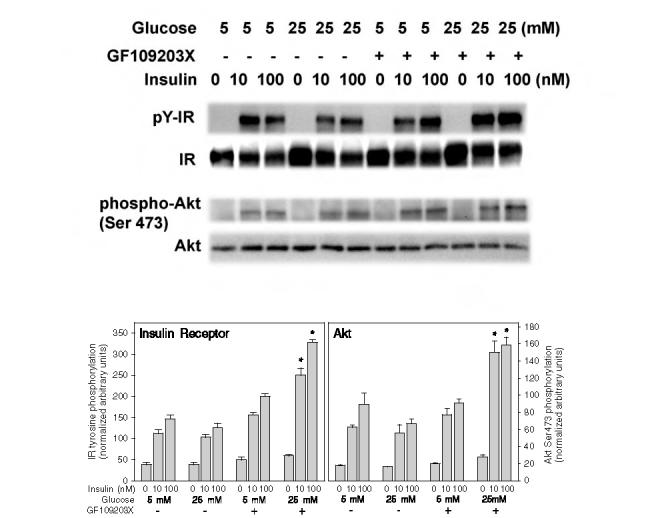
Effect of high glucose on insulin-stimulated tyrosine phosphorylation of the insulin receptor (IR) and Ser473 phosphorylation of Akt in primary rat adipocytes with and without inhibition of PKC. Primary rat adipocytes were incubated under the indicated glucose conditions for 24 h and then acutely stimulated for 5 min with 10 or 100 mM insulin prior to homogenization and western blotting as described in the legend to Fig. 4. The upper blots show the immunoblotting of the tyrosine phosphorylated insulin receptor (pY-IR) using anti-phosphotyrosine 4G10 antibody, the insulin receptor β-subunit (IR), Akt phosphorylated on Ser473 (phospho-Akt), and an Akt protein loading control (Akt). The lower bar graphs reflect the quantitation of the IR tyrosine phosphorylation (left panel) and Akt Ser473 phosphorylation normalized to the protein mass of the IR β-subunit or Akt (right panel). The asterisks indicate significant differences from the corresponding insulin-treated control cells cultured in 5 mM glucose (p < 0.001).