
Fig. 4.
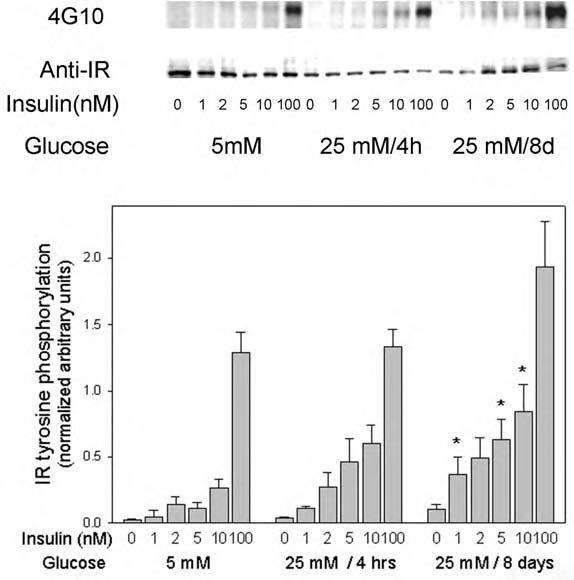
Effect of high glucose on insulin-stimulated tyrosine phosphorylation of the insulin receptor in 3T3-L1 adipocytes. Serum-starved 3T3-L1 cells, incubated under the indicated glucose conditions, were acutely stimulated with the indicated concentrations of insulin for 5 min. The reactions were stopped by snap-freezing the cells in liquid nitrogen followed by cell lysis into homogenization buffer, brief sonication, and micro-centrifugation. The cleared cell lysates (30 μg) were applied to 7.5% polyacrylamide gels containing SDS, transferred to PVDF membranes, and blotted with anti-phosphotyrosine antibody 4G10. After the signal was developed by ECL, membranes were stripped and reblotted with anti-insulin receptor antibodies. In the quantitated data on the bar graph, the asterisks indicate significant differences from the control cells cultured in 5 mM glucose (p < 0.05), as described in the text.